How do you use Amazon Product Opportunity Explorer to validate a niche?
Open it under Growth in Seller Central, pick the niche closest to your product, and read trends, search conversion, click share, successful launches and review insights. Use it to confirm demand exists. Then use a paid tool and your own margin model to check competitors, ad pressure and profitability before ordering inventory.
Key takeaways
- Product Opportunity Explorer sits under Growth in Seller Central and needs a Professional account at $39.99 a month.
- Niche search volume combines several phrases, so it will look bigger than single-keyword volumes in other tools.
- Click share and successful launches are first-party signals few other tools can show.
- POE does not show brand-level ad spend, seller depth or your costs, so pair it with a paid tool and a margin model.
Use Amazon’s Product Opportunity Explorer (POE) to confirm that shoppers are searching for and buying in a niche, then use a paid research tool to check who you would be competing against and what it would cost. POE is free with a Professional selling account and its demand data comes from Amazon itself, but it does not tell you everything you need before ordering inventory.
Below is how we read POE, which numbers we trust, which we treat with care, and how we combine it with other data.
What is Product Opportunity Explorer and who can use it?
POE is a research tool inside Seller Central under Growth > Product Opportunity Explorer. Amazon’s product page says it requires a Professional selling account, which costs $39.99 a month plus selling fees, as of October 2026. Access can also vary by marketplace and account permissions, according to SalesDuo’s September 2026 guide.
The tool groups related products and search terms into “niches.” Instead of looking at one ASIN or one keyword, you see a cluster of the search terms and products shoppers treat as one need.
Amazon also states that new products launched using POE insights have “2.5x higher sales potential” in their first three months. That is Amazon’s own claim about its own tool, without a published method, so we treat it as marketing rather than evidence.
Which POE metrics should you trust?
Here is how we rate the main metrics, based on what they measure and where they come from.
| Metric | What it tells you | How much we trust it |
|---|---|---|
| Search volume and growth | Demand for the niche across 7, 30, 90 and 360 days | High for direction; remember it combines several search phrases |
| Search conversion rate | How often searches in the niche end in a purchase | High; low conversion with high volume can signal unmet demand |
| Units sold (average) | Rough size of the market | Medium; useful for scale, not precise forecasts |
| Click share by product | How concentrated shopper attention is | High; this is first-party Amazon data most tools estimate |
| Average price and range | Where the market prices | High |
| Review counts and ratings | Maturity and quality of incumbents | Medium; same caveats as anywhere |
| Successful launches | Products that launched recently and gained traction | High value; few other tools show this |
| Sponsored Products share and Prime share | How ad-heavy and Prime-heavy the niche is | Medium; good context for ad budgeting |
| Return rate and review insights | Where products disappoint | High for product brief work |
The single most important caveat comes from SalesDuo: “niche search volume and keyword search volume are not the same.” A niche figure adds up multiple related phrases. If you compare it with a keyword volume from another tool, the POE number will look bigger. That does not mean the other tool is wrong.
How do you work through a niche step by step?
This is the sequence we use.
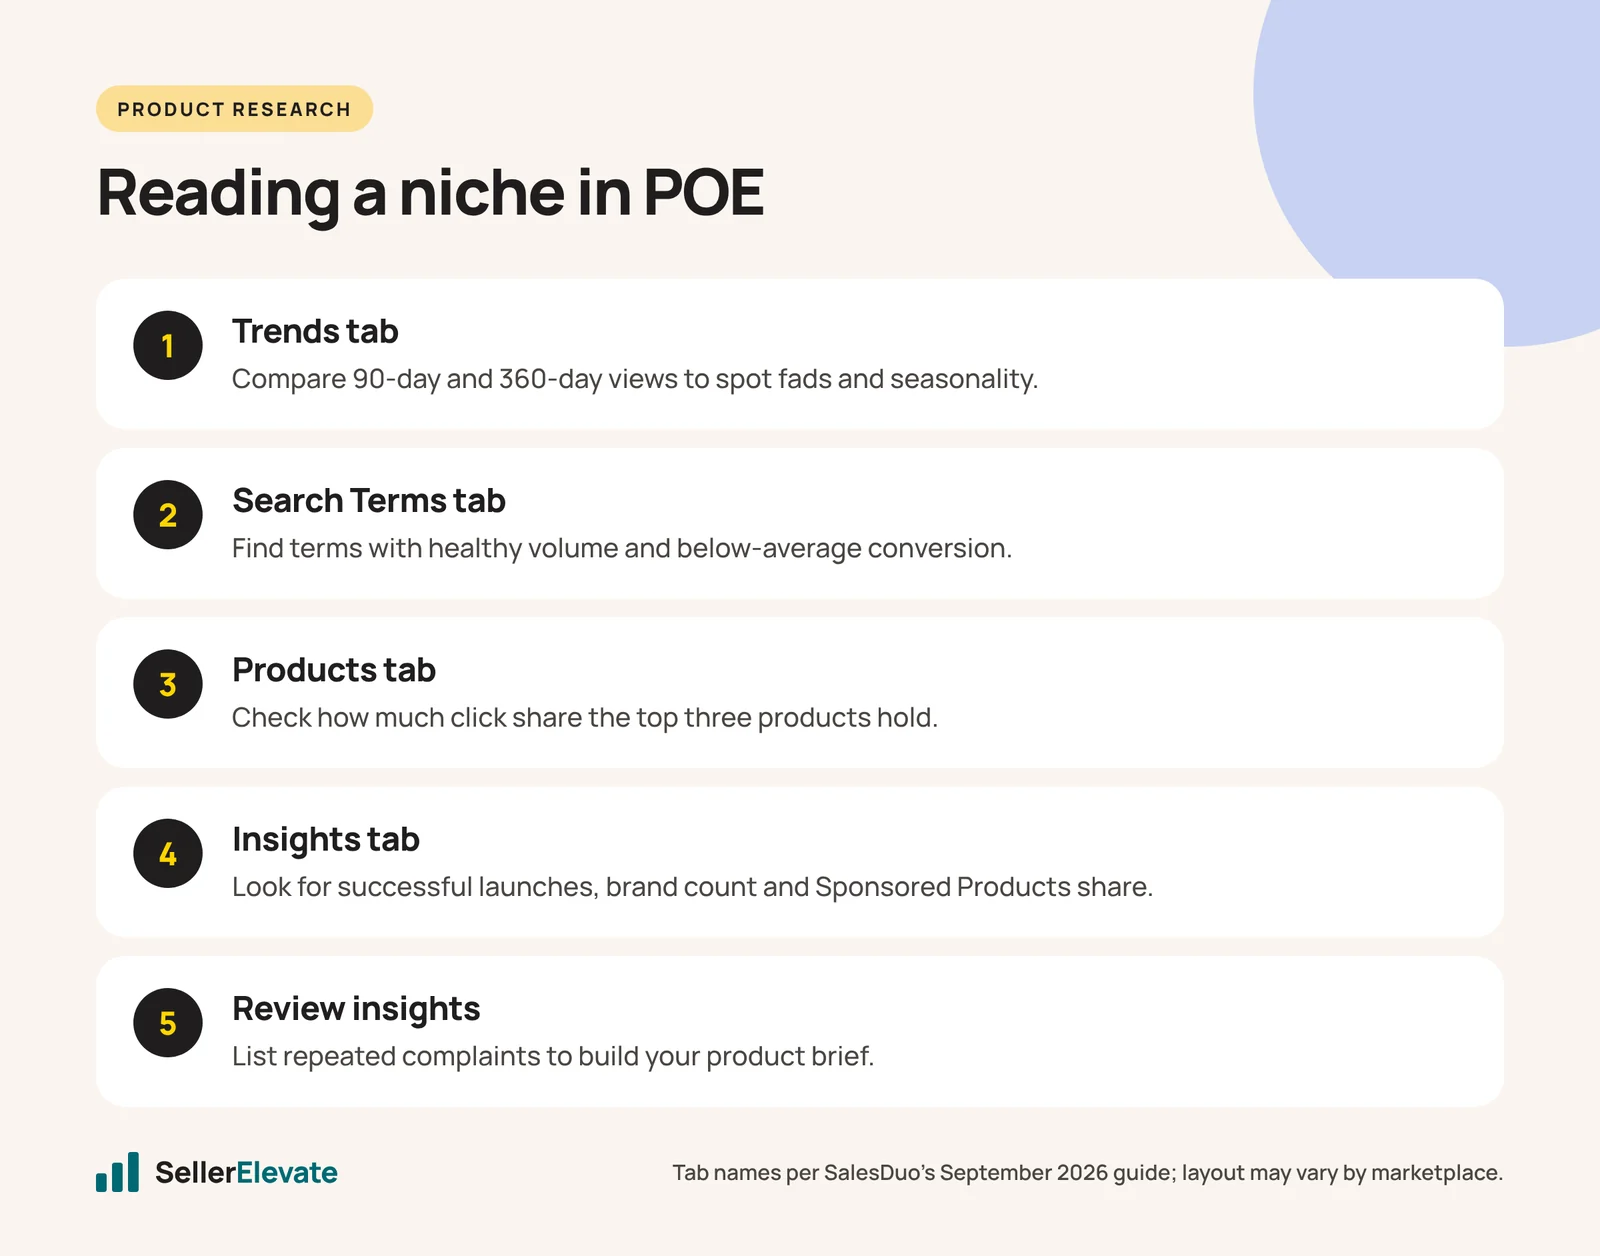
- Start with a seed keyword in the POE search bar and open the niche that best matches what you would actually sell. Skip niches that are broader than your product.
- Read the Trends tab first. Compare the 90-day and 360-day views. If the 360-day view shows a sharp spike then decline, you may be looking at a fad or a seasonal peak.
- Open the Search Terms tab. Look for terms with healthy volume and below-average conversion. That combination often means shoppers are searching and not finding what they want.
- Open the Products tab. Note click share for the top products. If the top three hold most of the clicks, the niche is concentrated even if it has many listings.
- Check the Insights tab for brand count, successful launches over the past year and the Sponsored Products share. Recent successful launches are the clearest signal that new entrants can win.
- Read Customer Review Insights. List the repeated complaints and feature requests. These become your product brief.
- Write down three numbers for the niche: average price, search conversion rate and number of successful launches. You will compare these across niches.
Repeat for three to five candidate niches before deciding. A niche only looks good or bad compared with alternatives.
What does POE not tell you?
SmartScout’s comparison (May 2026) is blunt about the gaps, and we agree with the main points. POE does not give you the depth of brand, seller, keyword or advertising intelligence that a dedicated platform does. It will not tell you directly whether Amazon itself is selling in the niche, how saturated the seller base is, or which brands are winning through heavy ad spend.
POE also does not know your costs. It cannot tell you landed cost, FBA fees, tariffs, certification needs or whether your margin survives the cost per click in that niche. SalesDuo makes the same point: POE is “useful for discovery, but it is not a complete product validation system.”
So the job split looks like this:
- POE answers: Is there demand? Is it growing? Do shoppers convert? Do new launches succeed? What do shoppers dislike?
- A paid tool answers: Who are the sellers and brands? How much do they spend on ads? What are the per-ASIN sales estimates and history? Is Amazon on the listing?
- Your own model answers: Can we make money at this price after fees, ads and returns?
How do you combine POE with a paid tool's sales estimates?
Use POE’s units sold and click share to sanity-check the paid tool. If a paid tool estimates the top product sells far more than the whole niche’s average units in POE would support, one of the numbers is off, and POE’s is closer to the source.
A simple worked check, with hypothetical numbers: POE shows a niche averaging around 9,000 units sold over 30 days, and the top product holds a 20% click share. A rough expectation for that product is in the region of 1,800 units a month if it converts at the niche average. If a paid tool says 6,000, dig into why before trusting it. If it says 1,500 to 2,200, the two sources roughly agree and you can plan with more confidence.
Paid tools mostly estimate sales from Best Sellers Rank. Our explainer on what a Best Sellers Rank means in sales covers why those estimates vary.
What we'd do this week
Pick three candidate niches. For each, spend 30 minutes in POE and fill in a one-row summary: search volume trend over 360 days, search conversion rate, top-three click share, successful launches, average price and the top two complaints from review insights.
Drop any niche where the top three hold most of the clicks and there have been no successful launches. For the rest, run the competition check from our post on how many reviews make a niche too competitive and build a quick margin model with real CPCs.
If you want this done alongside supplier quotes and fee modeling, our product research team runs the same process.
Frequently asked questions
Is Product Opportunity Explorer free?
There is no separate charge for the tool, but it requires a Professional selling account, which Amazon lists at $39.99 a month plus selling fees as of October 2026. Individual plan sellers cannot use it. Access can also vary by marketplace and account permissions.
What time ranges does Product Opportunity Explorer show?
SalesDuo's September 2026 guide lists 7, 30, 90 and 360 day views. Use the 360-day view to spot seasonality or a fading trend, and the 90-day view to see recent momentum. Comparing the two is often more useful than either one alone.
Why does POE search volume differ from other research tools?
POE reports niche search volume, which adds together several related search phrases. Third-party tools usually report volume for one keyword. The POE figure will often look larger. Neither is wrong; they measure different things, so compare niche figures with niche figures and keyword figures with keyword figures.
Can POE tell me if Amazon sells in the niche?
Not directly. SmartScout's comparison notes POE does not show whether Amazon itself competes in the space, or how much brands spend on ads. Check the top listings manually for Amazon as the seller, or use a paid research tool for seller-level and advertising detail.
Sources
- Amazon: Product Opportunity Explorer (accessed October 2026)
- SalesDuo: Amazon Product Opportunity Explorer guide (September 24, 2026)
- SmartScout: Amazon Opportunity Explorer vs SmartScout (May 22, 2026)
Get the honest version of your numbers
A free account audit from the person who would actually run your account.