What is a good email open rate and click rate for ecommerce in 2026?
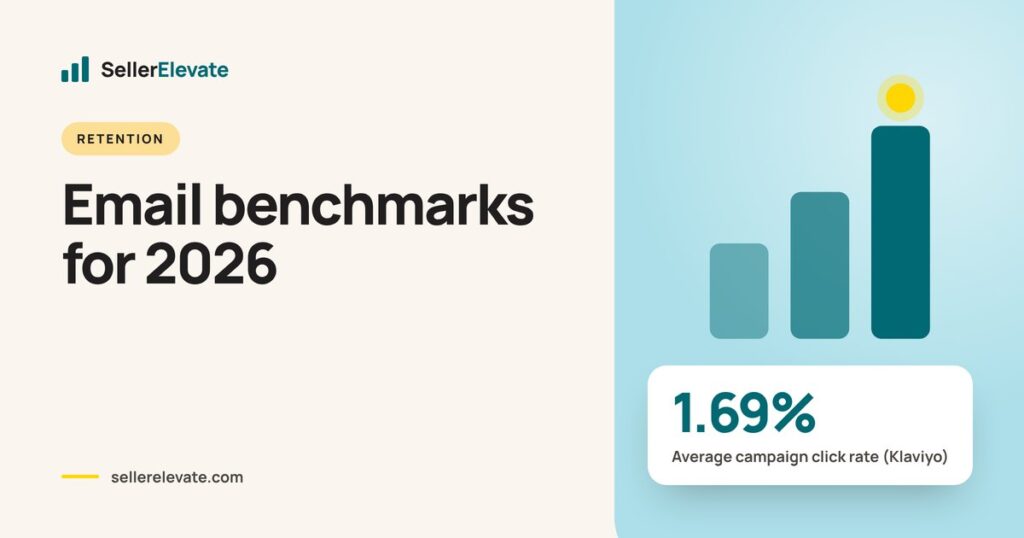
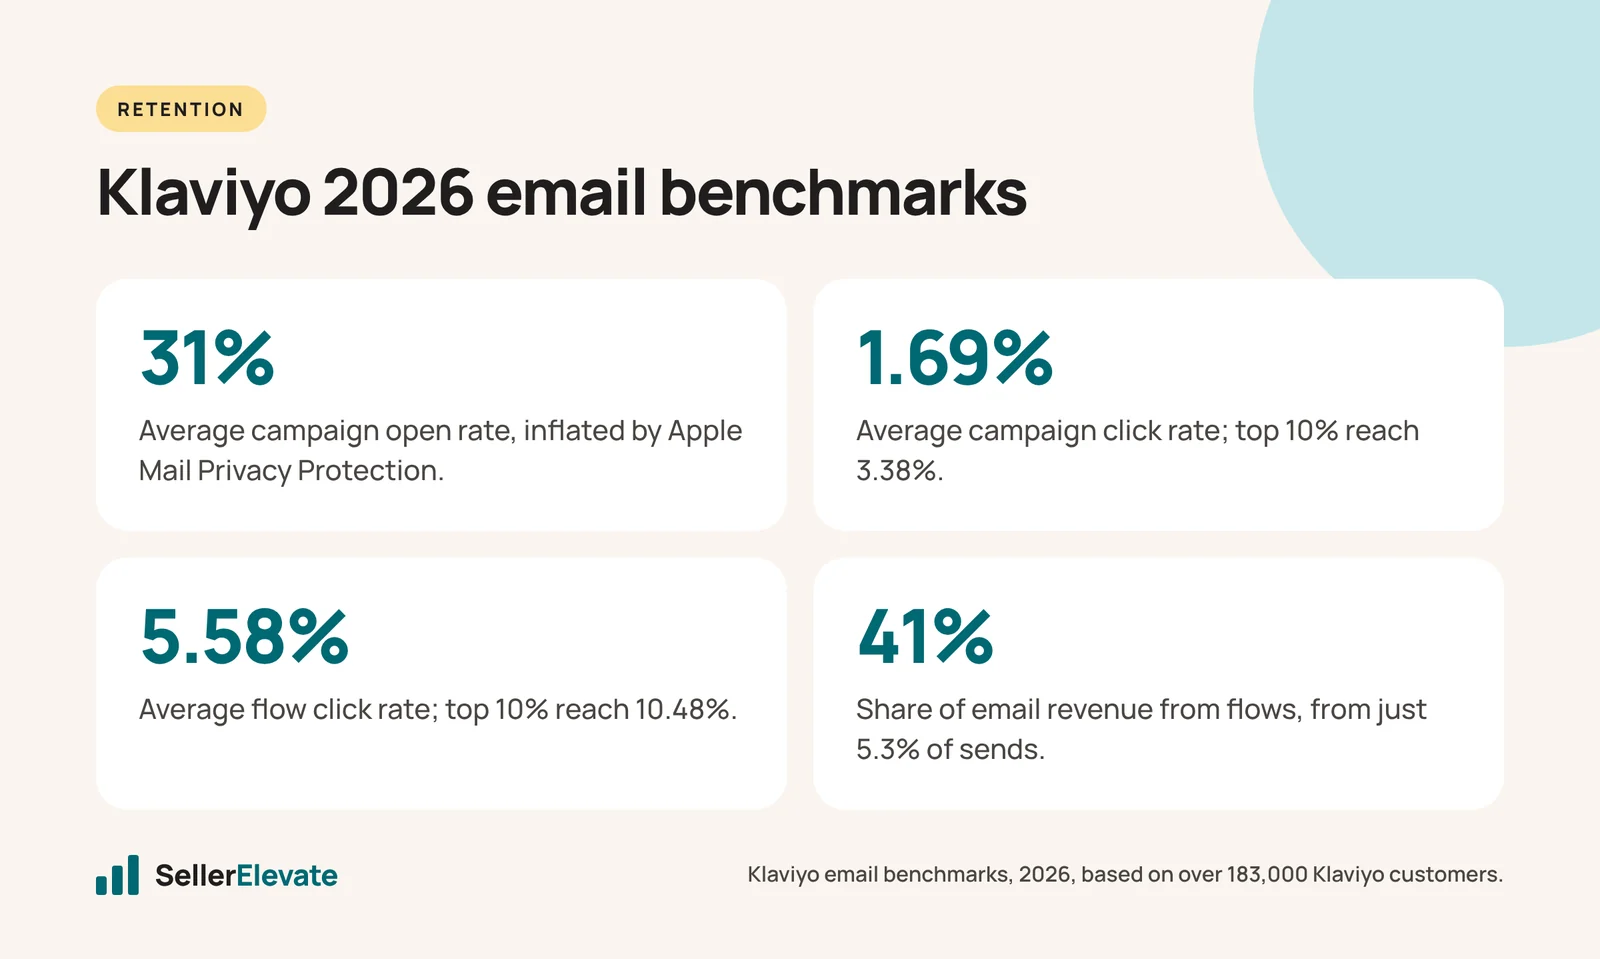
Klaviyo's 2026 benchmarks put average campaign opens at 31% and clicks at 1.69%, with the top 10% at 45.1% and 3.38%. Flows average a 5.58% click rate, so benchmark them separately. Open rates are inflated by Apple Mail Privacy Protection, so judge email on clicks and revenue per recipient.
Key takeaways
- Klaviyo's 2026 benchmarks put average campaign open rate at 31% and click rate at 1.69%.
- Flows average a 5.58% click rate, more than three times campaigns, so never benchmark them together.
- Apple Mail Privacy Protection inflates opens, so judge subject lines and engagement on clicks, not opens.
- Revenue per recipient is the best single metric; flows earn nearly 18 times more per recipient than campaigns.
- If flows produce far less than about 41% of email revenue, build flows before sending more campaigns.
A good ecommerce email campaign in 2026 opens around 31% and gets clicked by about 1.69% of recipients, according to Klaviyo’s benchmarks; the top 10% of brands reach 45.1% opens and 3.38% clicks. Automated flows are a different animal: they average a 5.58% click rate, so judging them against campaign numbers, or the other way around, will mislead you.
The bigger point is that open rate is the weakest of these numbers, and revenue per recipient is the one we’d run the program on. Here is what Klaviyo’s data says, how to read it, and what to do if you’re below it.
What are Klaviyo's 2026 email benchmarks?
Klaviyo publishes email benchmarks based on data from over 183,000 of its customers. The headline numbers:
| Metric | Campaigns (average) | Campaigns (top 10%) | Flows (average) | Flows (top 10%) |
|---|---|---|---|---|
| Open rate | 31% | 45.1% | 32.2% | 45.8% |
| Click rate | 1.69% | 3.38% | 5.58% | 10.48% |
| Order rate (range by industry) | 0.97% to 1.34% | n/a | 1.62% to 2.17% | n/a |
A few other figures from the same page are worth knowing:
- Flows produce nearly 41% of total email revenue from just 5.3% of sends.
- Revenue per recipient for flows is nearly 18 times higher than for campaigns, and top 10% flows reach $7.79 per recipient.
- Nearly 48% of flow revenue comes from new buyers, compared with 16% for campaigns.
- Emails using AI product recommendations average a 3.75% click rate, with top performers at 8.79%.
- Flow order rates range from 1.62% in clothing to 2.17% in home and garden.
Notice that open rates for campaigns and flows are almost the same, while click rates are more than three times apart. That alone tells you open rate isn’t measuring what most people think it measures.
Why is open rate a weak metric now?
Since Apple introduced Mail Privacy Protection in 2021, Apple Mail can load email content, including the tracking pixel, in the background whether or not the person reads the message. To your email platform, that looks like an open.
Two consequences follow. First, open rates are inflated, and how inflated depends on how many of your subscribers use Apple Mail, which you don’t control. Second, anything that relies on opens becomes unreliable: “engaged in the last 90 days” segments built on opens, subject line tests judged on opens, and sunset rules that keep people because they “opened.”
Klaviyo’s benchmark page doesn’t say how it treats these machine opens, so we can’t tell you whether the 31% figure includes them. We’d assume some inflation and check your own data: in Klaviyo you can look at opens by email client, and if a large share of your list is on Apple Mail, discount your open rate accordingly.
What open rate is still good for: spotting a sudden collapse. If opens drop sharply overnight, you probably have a deliverability problem (spam folder placement), and that is worth investigating fast.
Which metric should I judge email on?
We use three, in this order:
- Revenue per recipient (RPR). Revenue attributed to the email divided by people who received it. It folds in open, click and conversion, and you can compare it across sends of different sizes. Klaviyo’s 18x gap between flows and campaigns is an RPR comparison.
- Click rate. The best engagement signal left. A person had to act. Compare campaigns to the 1.69% average and flows to 5.58%.
- Placed order rate. For campaigns, Klaviyo’s industry range is 0.97% to 1.34%. If you’re far below while clicks look fine, the problem is the landing page or the offer, not the email.
Then two guardrails: unsubscribe rate and spam complaint rate. A campaign with a great RPR that doubles your unsubscribes may cost you more next month than it earned.
Be careful with attribution windows. Email platforms credit revenue to an email if the person clicked or opened within a set window before buying. With inflated opens, open-based attribution overstates email revenue. When you compare RPR over time, keep the window the same and, if you can, look at click-based attribution only.
My numbers are below benchmark. What do I fix first?
Use the gap to diagnose, not to panic. A quick decision table:
| What you see | Likely cause | First fix |
|---|---|---|
| Opens far below 31% on campaigns | Deliverability or a list full of inactive contacts | Suppress long-inactive subscribers, check authentication (SPF, DKIM, DMARC), send to engaged segments first |
| Opens fine, clicks well under 1.69% | Content: one weak offer, no clear reason to click | One message, one call to action, product images that link to the product |
| Clicks fine, order rate under 0.97% | Landing page, price, or a mismatch with the email | Link to the exact product, keep the offer consistent, check mobile checkout |
| Campaigns fine, flows clicking far under 5.58% | Flows are generic or badly timed | Rebuild welcome and abandoned checkout first |
| Flows a tiny share of email revenue | Flows missing or switched off | Build the core flows before sending more campaigns |
That last row is the most common one we see. If flows produce far less than about 41% of your email revenue, the fix is not a better subject line. It’s the flows. We cover which to build first, and in what order, in email flows vs campaigns.
A worked example
Take a hypothetical brand with 20,000 subscribers sending two campaigns a week. Its campaigns open at 38%, which looks well above benchmark, and the team is pleased.
Clicks, though, sit at 0.9%, about half of the 1.69% average. Placed order rate is 0.4%. On a $55 average order, each campaign makes roughly 80 orders and $4,400, or $0.22 per recipient.
The high open rate was hiding the problem. The list skews heavily to Apple Mail, so opens are inflated, and the emails are long newsletters with five links and no single offer. The fix is content and segmentation: one product story per email, a clear call to action, and sending the full list only when there is a real reason to. If clicks reach the 1.69% average and conversion from click holds, orders nearly double without growing the list.
None of these figures are from a real client. They show why you start with clicks and RPR and treat a high open rate with suspicion.
What we'd do this week
- Export the last 90 days of campaigns with opens, clicks, placed orders, revenue and recipients. Add an RPR column.
- Separate campaigns from flows in every report. Never average them together.
- Check opens by email client. If Apple Mail dominates, stop judging subject lines on opens; use clicks.
- Find your share of email revenue from flows. If it’s well under 41%, flows are the priority.
- Review your engaged segment definition. If it relies only on opens, add clicks, site visits or orders.
- Pick the two campaigns with the lowest RPR and work out what they had in common.
If your email program sits next to Amazon or TikTok Shop and you’re trying to understand how it fits the whole business, our account management team looks at email alongside the marketplaces, and the free audit is a good first step. For how retention fits into marketplace growth, see how Amazon brands win the second purchase.
Frequently asked questions
Is a 50% email open rate good?
It is above Klaviyo's 45.1% top 10% campaign figure, but it may not mean what it seems. Apple Mail Privacy Protection can record opens without a person reading the email, so a very high open rate with weak clicks often reflects an Apple-heavy list, not strong engagement. Check clicks and revenue per recipient before celebrating.
What is a good click rate for an abandoned cart or welcome email?
Compare automated emails to flow benchmarks, not campaigns. Klaviyo's 2026 flow average click rate is 5.58%, with the top 10% at 10.48%. Klaviyo's benchmark page does not break this out by individual flow type, so track your own welcome and abandonment flows against that overall flow figure.
How do I calculate revenue per recipient?
Divide the revenue attributed to an email or flow by the number of people who received it. It combines open, click and conversion into one figure and lets you compare sends of different sizes. Keep the attribution window the same when comparing over time, and favor click-based attribution.
Do AI product recommendations improve email clicks?
Klaviyo reports emails with AI product recommendations average a 3.75% click rate, with top performers at 8.79%, compared with 1.69% for campaigns overall. Those are platform averages, not a controlled test, so try personalized product blocks in one recurring campaign and compare clicks against your own baseline.
Sources
Get the honest version of your numbers
A free account audit from the person who would actually run your account.