Should I track MER, ROAS or contribution margin?
Track all three, at different levels. Contribution margin decides whether the business makes money, so set that target first. Derive the MER you can afford from it to set total marketing spend. Use platform ROAS only to choose between campaigns, ads and audiences inside each channel.
Key takeaways
- Contribution margin is the target; MER and ROAS are tools for hitting it.
- Break-even ROAS equals 1 divided by gross margin, so a 50% margin needs a 2.0 ROAS to break even.
- MER can fall while you scale profitably, as Segwise's example of MER dropping from 5.0 to 4.7 shows.
- Platform ROAS can rise when spend shifts to retargeting even if incremental revenue stays flat.
- Set channel ROAS guardrails above your target MER and review MER weekly.
Contribution margin runs the business. Set a contribution-margin target first, work out the MER (total revenue divided by total marketing spend) that target allows, and use platform ROAS only to steer budget inside each channel.
The three numbers are not rivals. They answer different questions at different levels, and most of the arguments between founders and media buyers happen because someone is using one number to answer a question that belongs to another.
What is the difference between ROAS, MER and contribution margin?
| Metric | Formula | Question it answers | Weakness |
|---|---|---|---|
| ROAS | Attributed revenue in a channel ÷ ad spend in that channel | Which campaign, ad or audience is working inside this platform? | Relies on the platform’s own attribution; ignores costs |
| MER | Total revenue ÷ total marketing spend | Is marketing as a whole producing enough revenue? | Ignores costs; falls when you scale even if ads improve |
| Contribution margin | Revenue minus all variable costs, including marketing | Did we make money after paying for everything a sale needs? | Needs clean cost data; slower to calculate |
The definitions above follow Admetrics’ MER vs ROAS guide, which describes ROAS as platform-reported revenue divided by spend in that platform, and MER as total company revenue divided by total marketing spend across channels. Saras Analytics defines contribution margin as how much cash remains after all variable costs required to generate the sale are paid, and writes it at the order level as:
Contribution margin = Revenue − (COGS + discounts + shipping and fulfillment + transaction fees + returns + marketing spend)
Notice what is missing from both ROAS and MER: every cost except advertising. Saras lists the blind spots: discounts, returns, shipping zones, fulfillment fees, payment fees, marketplace commissions and landed cost changes. A 4.0 ROAS on a product with thin margins can lose money. A 2.0 ROAS on a product with fat margins can be very profitable.
Why is in-platform ROAS less trustworthy now?
Two reasons. First, platforms measure their own credit. Since privacy changes reduced tracking across apps and browsers, each platform models more of the conversions it claims, and different platforms can claim the same sale. Our post on Meta’s 2026 attribution changes covers how that shows up in reported ROAS.
Second, ROAS rewards the wrong behavior if you let it. Admetrics points out that ROAS can rise when spend shifts to retargeting or branded demand capture, even if incremental revenue stays flat. Retargeting people who were going to buy anyway produces beautiful ROAS and very little new revenue.
That does not make ROAS useless. It is still the fastest signal for choosing between two ads, two audiences or two bids inside one platform. It just should not decide how much the business spends in total.
Is MER the answer, then?
MER is better for total budget decisions because it cannot be gamed by attribution: revenue is in your bank account and spend is on your invoices. Admetrics says many brands aim for an MER in the 3 to 6 range, but that you should set targets from your CAC and payback requirements. We would go further: a generic MER target is close to meaningless without your margin.
MER also has a trap. Segwise’s critique of MER gives an example: a brand at $20M revenue with $4M ad spend has an MER of 5.0. A year later it reaches $50M with $10.6M of spend, an MER of 4.7. MER fell. But in that example ROAS improved from 2.5x to 3.7x and net contribution dollars roughly doubled. A team managing to protect an MER of 5.0 would have cut profitable spend to protect a ratio.
This happens because MER blends paid revenue with revenue you would have had anyway. As paid spend grows, it is a larger share of total revenue, and the ratio drifts down even when every new dollar is profitable. Segwise suggests watching marginal MER, incremental revenue divided by incremental spend, alongside the blended figure. That is the question you actually care about when increasing budget: what did the extra money buy?
How do I set the targets, step by step?
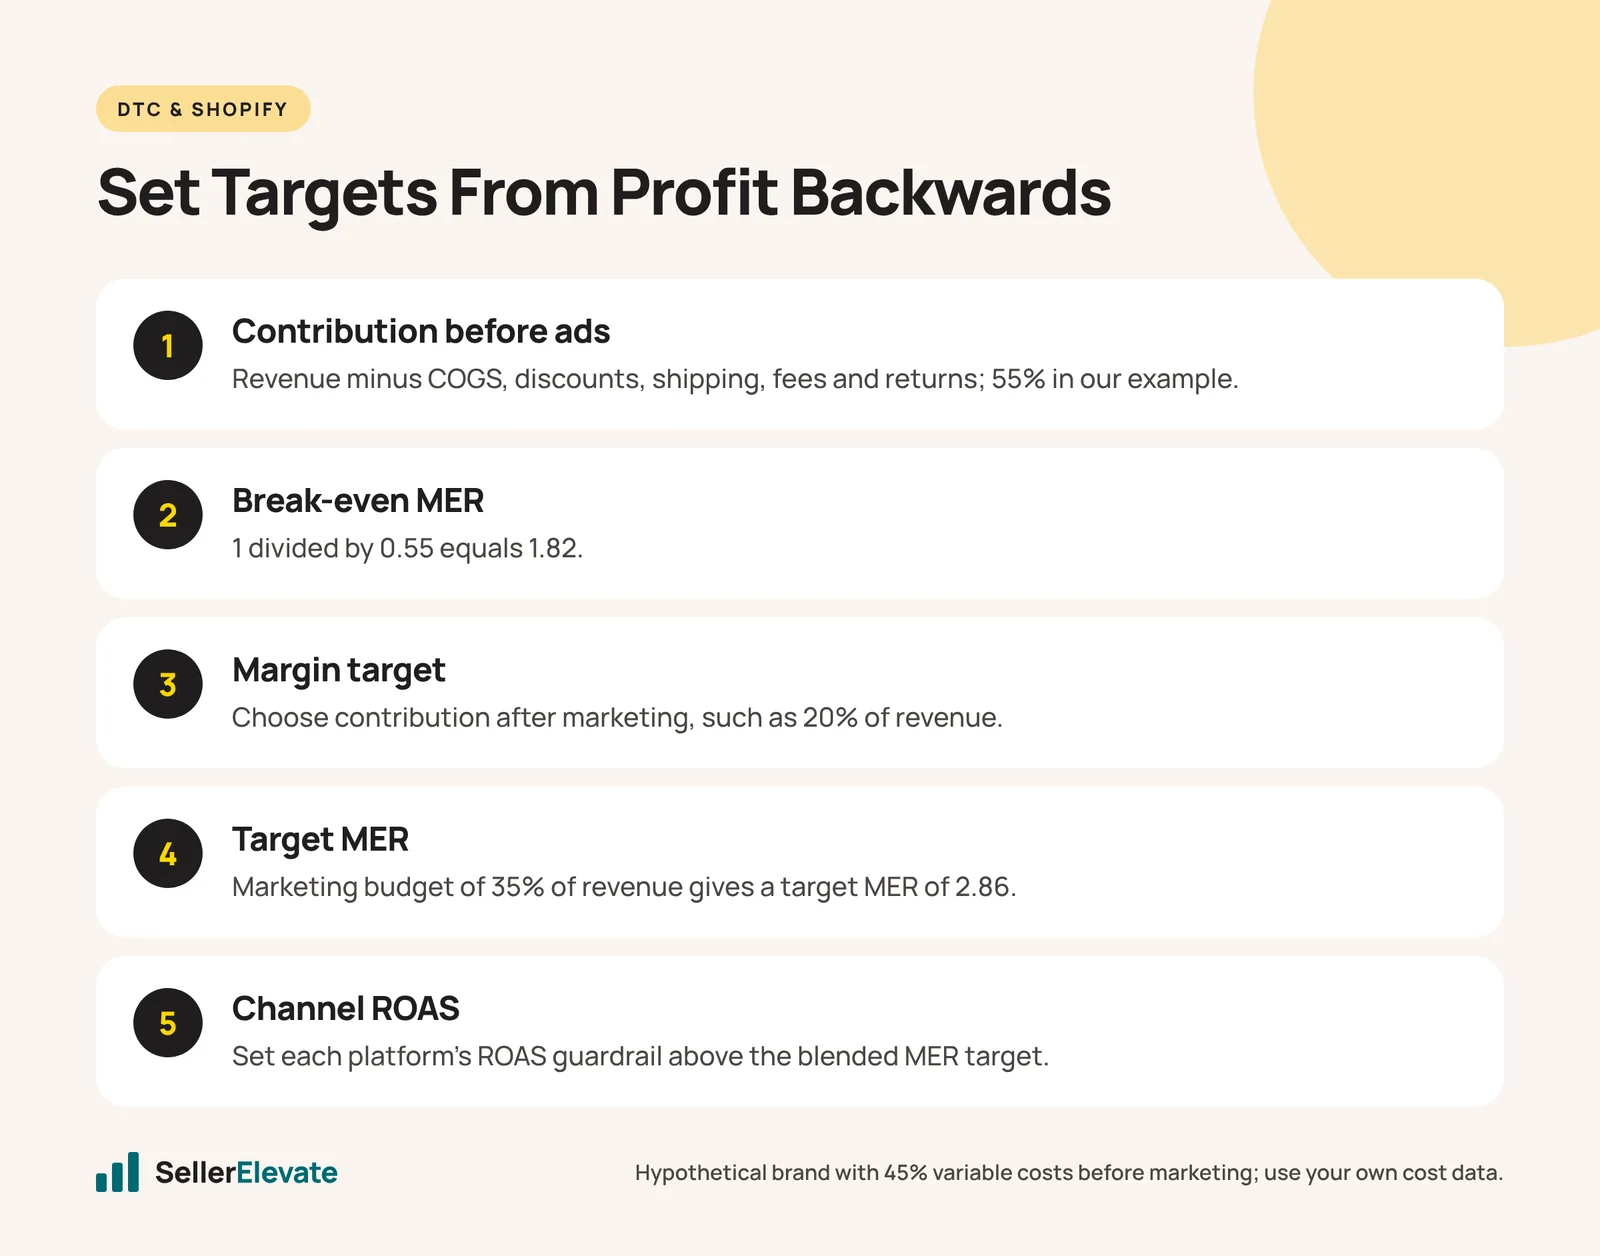
Work from profit backwards. Here is the sequence with a hypothetical brand: average order $60, and variable costs before marketing (COGS, discounts, shipping, payment fees, returns) of 45% of revenue.
- Work out contribution before marketing. 100% − 45% = 55% of revenue is left to pay for marketing and profit.
- Find your break-even MER. 1 ÷ 0.55 = 1.82. Below that, marketing costs more than the margin it buys. This mirrors Saras’ break-even ROAS rule: if gross margin is 50%, break-even ROAS is 2.0.
- Set the contribution margin you need after marketing. Say 20% of revenue, to cover fixed costs and leave profit. That leaves 55% − 20% = 35% of revenue for marketing.
- Turn that into a target MER. 1 ÷ 0.35 = 2.86. Total marketing spend should produce at least $2.86 of revenue per dollar.
- Set channel ROAS guardrails. Each channel’s platform ROAS target should sit above the blended MER target, because platforms usually over-credit themselves and some revenue comes from organic and repeat customers. How far above depends on your own comparison of platform-reported revenue with actual revenue, which you can only get by watching both over a few months.
- Review weekly. Segwise recommends tracking MER as a guardrail weekly, not daily.
The 20% in step 3 is your decision, not an industry rule. A brand in growth mode with strong repeat purchase might accept 5% contribution on the first order. A brand that needs cash this quarter might demand 25%. Saras’ payback example shows why: with a $60 CAC and $30 of contribution per order, payback takes two orders. If customers rarely reorder, you need the profit on the first one. Our post on what drives the second purchase gets into that.
How does this look on Amazon?
Amazon sellers use the same logic with different labels. Platform ROAS (or its inverse, ACoS) steers campaigns; TACoS, total ad spend divided by total sales, plays the role of MER. In one account we managed, a single SKU took $358K of ad spend at a 4.00 ROAS with TACoS under 10%. That ROAS alone would not have told us whether to keep spending. The TACoS and the margin did.
The same principle showed up in a listing rebuild we published: ad spend rose 25% and net profit rose 81.5% quarter on quarter. If we had judged that quarter on ROAS alone, we would have missed the point, which was profit.
What would we do this week?
- Build a contribution margin sheet per product with every variable cost listed above. If you cannot fill a line, that is your first task.
- Calculate break-even MER and target MER using the steps above.
- Pull last month’s total revenue and total marketing spend and compare actual MER to the target.
- Compare platform-reported revenue to actual revenue for each channel. The gap tells you how much to discount each platform’s ROAS.
- Set ROAS guardrails per channel and let media buyers optimize within them.
- Report contribution margin dollars to leadership, not ROAS screenshots.
Mistakes to avoid: celebrating ROAS that rose because spend moved to retargeting, cutting profitable spend to keep a blended MER high, and setting an MER target copied from another brand with a different margin. If your ROAS looks fine and the bank balance does not, that is worth an account audit to find which cost is missing from the math.
Frequently asked questions
What is a good MER for a DTC brand?
It depends on your margin. Admetrics says many brands aim for 3 to 6, but a brand with 55% contribution before marketing breaks even at an MER of 1.82, while a low-margin brand may need far more. Set your target from your margin and payback needs.
What is marginal MER?
Marginal MER is incremental revenue divided by incremental marketing spend. It shows what the extra budget actually bought, which blended MER hides because it mixes paid revenue with revenue you would have earned anyway. Use it when deciding whether to raise spend.
Is TACoS the same as MER?
Close. TACoS is total ad spend divided by total sales, so it is roughly the inverse of MER applied to Amazon ads. Both look at total sales rather than platform-attributed sales, which makes them harder for any single ad platform to inflate with its own attribution.
How often should I check contribution margin?
Monthly for the full calculation, since costs like returns and fees settle with a lag. Check MER weekly as a guardrail, as Segwise recommends, and let media buyers use platform ROAS daily within the guardrails and limits you set for each channel.
Sources
- Admetrics: MER vs ROAS for DTC teams (undated)
- Saras Analytics: ROAS vs contribution margin (undated)
- Segwise: MER is lying to you (undated)
Get the honest version of your numbers
A free account audit from the person who would actually run your account.